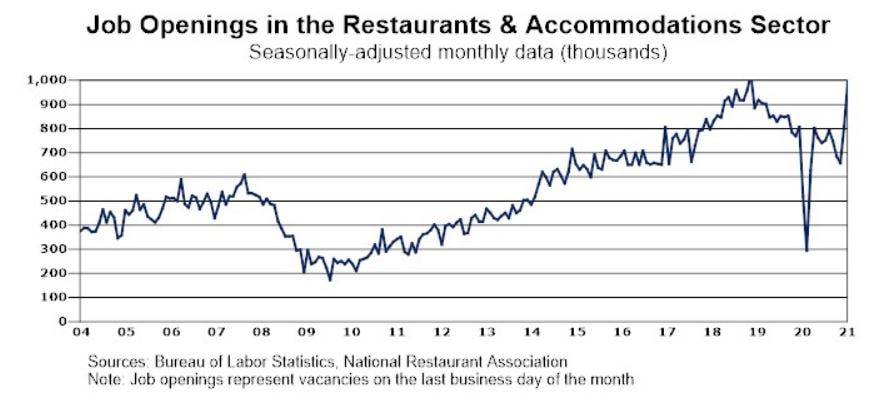
from the National Restaurant AssociationNormally during this time of year, restaurants across the country would be staffing up for the opening weekend of the summer season. These summer jobs are typically filled by a wide variety of individuals – teenagers, college students, teachers – even retirees who want to pick up a couple shifts at the 19th hole of their local golf course. While the restaurant industry is expected to expand payrolls this summer, it will likely be a mix of both coronavirus recovery and seasonal jobs. Most operators are still well below normal staffing levels, and are working to rebuild their teams as business conditions improve. This article examines some of the factors that will impact restaurant job growth during the 2021 summer season. A summer employment juggernaut
The restaurant industry is typically the nation’s second largest creator of seasonal jobs during the summer months – ranking only behind the construction industry. In the five years prior to the pandemic (2015-2019), eating and drinking places* added an average of 511,000 jobs during the summer season. On average during the 2015 – 2019 period, the states that added the most eating and drinking place jobs during the summer seasons were New York (41,000), California (35,400), Massachusetts (28,600), New Jersey (25,800), Texas (24,400), Illinois (22,200), Ohio (18,200), Michigan (17,700), Maryland (15,200) and North Carolina (15,200). The states that registered the largest proportional employment increases during the 2015 – 2019 summer seasons were Maine (30%), Alaska (20%), Delaware (17%) and Rhode Island (15%). View the historical summer employment data for every state. Historically, the availability of labor in April and May had a direct impact on the ultimate size of the restaurant industry’s summer workforce. In 2015, eating and drinking places added a record 555,300 jobs during the summer season. In the Association’s April and May tracking surveys that year, only 14% of operators said recruiting and retaining employees was the top challenge facing their business. In general, the labor pool was sufficient to meet the industry’s summer staffing needs. In the latter half of the 2010s, an increasing proportion of restaurant operators said recruiting and retaining employees was the number-one challenge facing their business. By April and May of 2019, 45% of operators held this sentiment. That summer, eating and drinking places added just 475,200 seasonal jobs. In percentage terms, that represented the smallest summer hiring season since 2008. In May 2021, 72% of restaurant operators said recruiting and retaining employees was their top operational challenge. That was up from 57% in April, and represented the highest reading in the nearly 20-year history of the Association’s monthly tracking survey. If recent history is a guide, this could potentially curtail summer staffing growth. Job openings near record high Restaurants in some parts of the country often begin ramping up hiring for the summer season in April and May. This year, unfilled job openings in the hospitality sector were already near a record high on the last business day of March. The restaurants-and-accommodations sector had 993,000 job openings on the last business day of March, according to Job Openings and Labor Turnover (JOLTS) data from the Bureau of Labor Statistics (BLS). That was up 51% from January’s level, and represented the second highest monthly reading since the JOLTS data series began in 2000. These numbers will likely push well into record territory as more data becomes available. Restaurant operators confirmed that the labor pool was very shallow. In an Association survey fielded during the first half of April 2021, 82% of operators said they had job openings that were difficult to fill. Teens are getting back to work On the aggregate, it likely won’t be a lack of teenagers looking for work that causes staffing shortages this summer. According to BLS data, there were 135,000 more teenagers in the labor force in April 2021 than there were in February 2020 before the pandemic began. This is generally good news for both teenagers and restaurants. Prior to the pandemic, restaurants were the largest employer of teenagers, providing job opportunities for 1.7 million 16-to-19-year-olds (or 34% of all working teens). At the same time, teenagers made up 18% of the restaurant workforce. This ranked only behind the 25-to-34 (23%) and 20-to-24 (21%) age cohorts. While teenagers have fully returned to the labor force, the numbers remain well below pre-pandemic levels in all of the other age groups. Overall, there were 3.5 million fewer people in the labor force in April 2021 than there were in February 2020. The deficit is largest in the 55-and-older age group. Of the more than 1.6 million adults age 55 and older who left the labor force between February 2020 and April 2020, only 327,000 have returned. While this age cohort only made up 11% of restaurant employees in 2019, it was easily the fastest growing component of the industry workforce in recent years. Weekly hours hit a record high Many restaurant operators that are having difficulties filling job openings are increasing the hours of their current employees. According to BLS data, eating and drinking place employees worked an average of 25.9 hours per week in March 2021. That was more than a full hour longer than the average workweek in February, and represented the highest monthly reading since this data series began in 2006. In the fullservice segment, employees worked an average of 26.4 hours in March 2021 – by far the highest reading on record. If labor challenges persist in the months ahead, look for these indicators to climb further into record territory. For more information visit https://restaurant.org/articles/news/summer-hiring-likely-to-be-challenged
0 Comments
Leave a Reply. |
AuthorWrite something about yourself. No need to be fancy, just an overview. Archives
June 2026
Categories
All
|


 RSS Feed